In my last post, I discussed building a lightweight VMware infrastructure for a customer using a Synology RS2414RP+ NAS. Today, I wanted to do some performance testing and baselining to get an idea of the kind of load it would support. To do this, I used a VMware Fling called VMware I/O Analyzer. A Fling is an ad-hoc tool built by VMware engineers or the community as one-off side projects.
This particular fling is presented as a downloadable .OVF that you load into your VMware environment as a virtual machine and it acts as a web-based GUI wrapper for Iometer. I could just use Iometer directly, but I still would have had to create a VM for it and this fling has some neat features that I like to use. It’s easy to download, load it up, and get running with minimal effort.
For this test, I was really just trying to get some baseline numbers for the maximum IOPS of this environment. Now, every environment is a little bit different and the conclusions you draw from a test like this don’t really tell you the whole picture, but it gives you a place to start.
I used four of the Fling’s built-in tests: Max Read IOPS, Max Write IOPS, Exchange 2007 Simulation, and SQL 64K. I’ll link the raw data in XLSX format if you want to look at the results in more detail. There is a ton of data, so the information I’m presenting is only a small subset.
Environment summary:
Synology RS2414RP+ with 3x3TB drives using SHR RAID
-Western Digital RED Enterprise 3TB 7200RPM 6Gb/s SATA
3x1Gb NIC (NAS side)
2x1Gb NIC (Host side) configured as A/A MPIO
The tests were run with all VMs shut off with the exception of the VCSA. However, my I/O Analyzer was running on a different host and loaded onto local storage. I created a 20GB test LUN on the NAS and formatted it Thick-Provisioned Eager Zeroed as recommended by the fling documentation. This minimized the amount of non-test work on the NAS so that the results didn’t get skewed. Each test was run for a two-minute test interval.
TESTS:
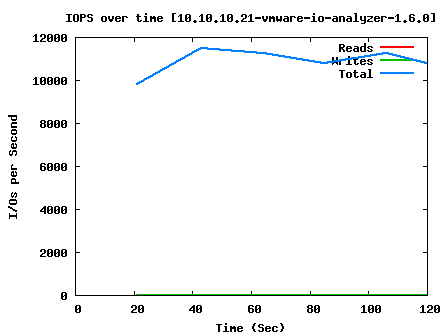
Max Read IOPS:
AccessSpec=0.5k_100%Read_0%Random
IOps=11188.16
ReadIOps=11188.16
WriteIOps=0.00
MBps=5.46
ReadMBps=5.46
WriteMBps=0.00
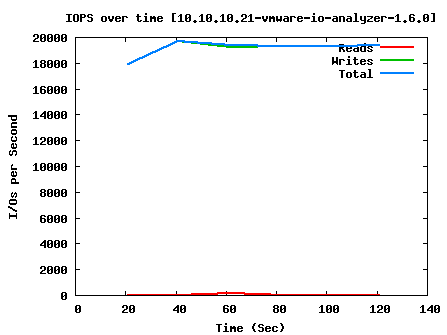
Max Write IOPS:
AccessSpec=0.5k_0%Read_0%Random
IOps=19397.18
ReadIOps=0.00
WriteIOps=19397.18
MBps=9.47
ReadMBps=0.00
WriteMBps=9.47
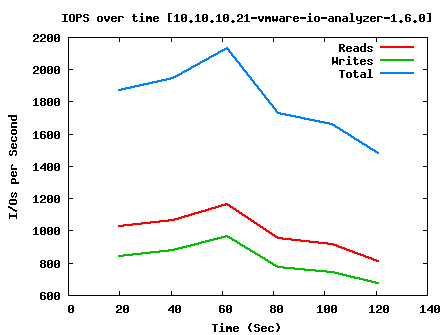
Exchange 2007 Simulation:
AccessSpec=8k_55%Read_80%Random
IOps=1825.23
ReadIOps=1003.96
WriteIOps=821.27
MBps=14.26
ReadMBps=7.84
WriteMBps=6.42
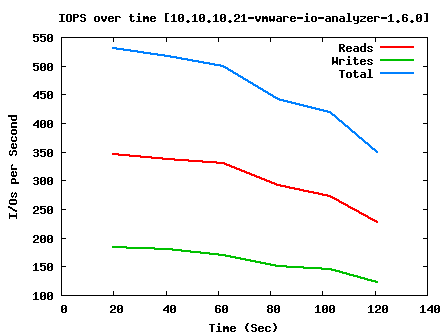
SQL 64k Simulation:
AccessSpec=64k_66%Read_100%Random
IOps=462.59
ReadIOps=304.25
WriteIOps=158.34
MBps=28.91
ReadMBps=19.02
WriteMBps=9.90
As you can see, we have pretty good performance when doing raw read and write; around 15,000 IOPS average. SQL performance with large blocks take a pretty big hit, but is still manageable for the workload we’re going to throw at it, and Exchange should also run passably well. For the smallish environment that will use this system, I don’t think the users will have any complaints about system responsiveness.
If you found this post to be helpful, be sure to subscribe it, like it, reblog it, retweet it, or otherwise tell all your friends!
2 thoughts on “Performance testing a Synology NAS using Iometer”
Comments are closed.


Reblogged this on Peer2Peer Consulting.